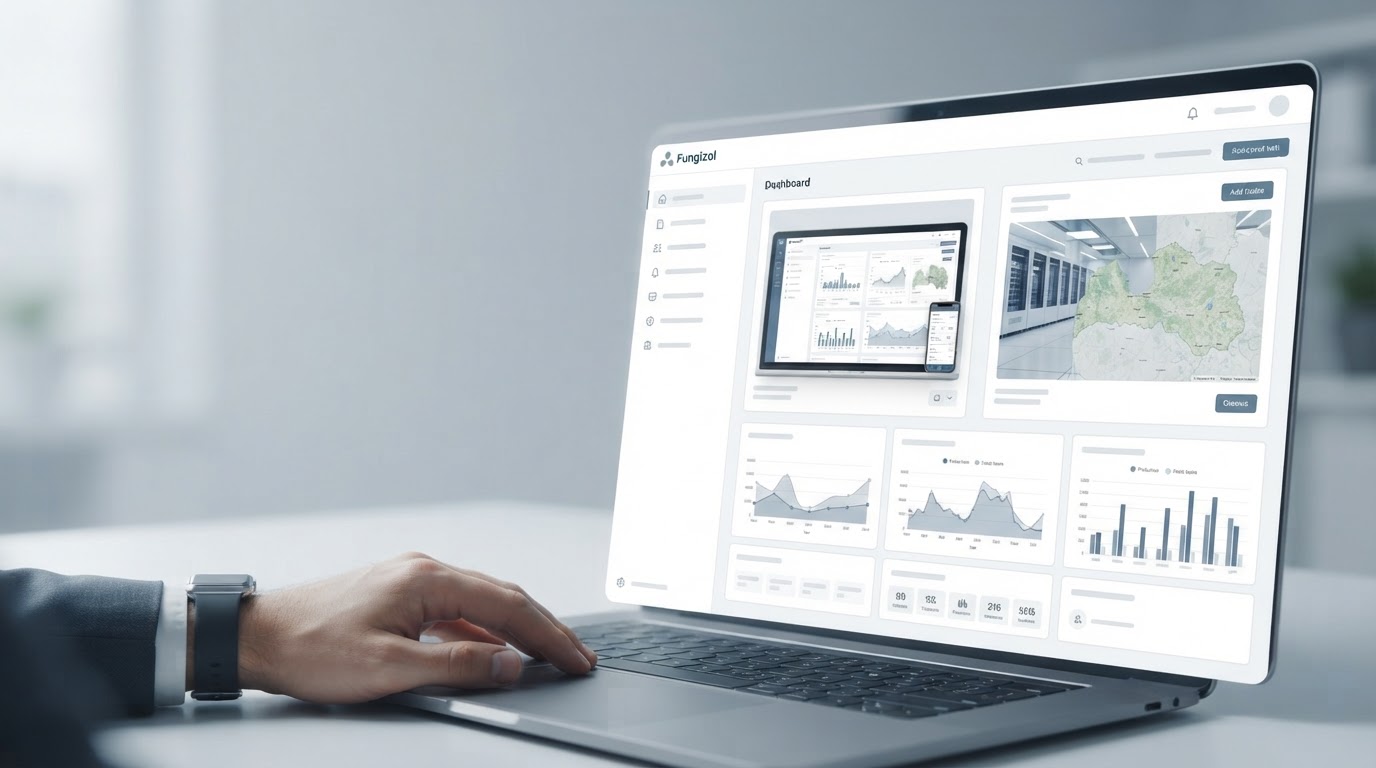
Fungizol dashboard with multi-stock data analysis

One dashboard for all your exchanges, based on predictive data analysis

Fungizol aggregates market data from multiple exchanges in real-time and transforms it into clear, risk-based recommendations—without the need to constantly track every price move yourself.

The dashboard displays aggregated indicators from connected accounts, risk rating for each position and model-generated recommendations that update with market data.

The problem

Scattered data creates noise, not clarity

Multiple exchange accounts mean multiple interfaces, different data formats, and constant switching between windows to get the full picture.

  • 1
    Fragmented accounts. Each exchange shows its data separately, so the overall risk level remains invisible.
  • 2
    Manual monitoring. Decisions are based on the last price checked, not on the current picture.
  • 3
    Lack of time. Busy parents and professionals rarely have time to watch schedules for several hours a day.
  • 4
    Signals noticed late. By the time a deviation is detected manually, the best time to act is often already past.

Fungizol solves this problem by combining all connected accounts into one dashboard and applying a single layer of analysis. Instead of switching between apps, the user sees one consistent picture — with the same measurements regardless of which exchange the data comes from.

The result is less time spent comparing data and more clarity when making a decision.

Solution

A unified dashboard and predictive analytics engine

Two components work together: a data fusion layer and a model that looks for patterns in historical and current data.

Support for multiple exchanges

Unified dashboard

Connect multiple exchange accounts and see positions, liquidity and risk indicators in one view, without having to switch between apps.

Real time data

Real-time data analysis

Incoming price and volume feeds are processed continuously so that the information displayed on the dashboard reflects the current state of the market and not an outdated snapshot.

Predictive models

Predictive analytics engine

Statistical models look for recurring patterns in historical data and estimate which scenarios are statistically more likely, rather than providing guaranteed predictions.

Automation

Automated Insights

Significant changes are collected in organized insights to see what's important without having to manually filter the data every day.

Technical basis: data from each connected exchange is normalized into a single format before entering the analysis layer. This means that comparisons between exchanges are fair and not based on different units of measurement or time zones.
About Fungizol

Designed for users who do not have time to constantly follow the market

Fungizol was created as a response to a practical situation: investors with busy schedules want to monitor their investments in several exchanges, but cannot afford to spend several hours a day on it.

The platform brings technical complexity—data collection, normalization, and modeling—into one easy-to-understand dashboard so that decisions are based on data, not the last graph you saw.

Fungizol team work environment for data analysis platform development
Risk management

Risk management based on predictive modeling

De-risking is the main advantage of Fungizol - not promises of profit, but a structured way to assess how much a position is exposed to volatility.

Risk distribution by positions

A simplified representation of how the panel visually divides positions by calculated risk level.

Low risk
Medium risk
Increased risk
  • Each position is assigned a risk rating that takes into account volatility and historical behavior under similar conditions.
  • Deviations from the usual pattern are highlighted so that they don't slip by in the rush of everyday life.
  • Insights are presented in plain language, not just raw numbers or technical terms.
  • Decision making is left up to the user - the system provides a framework rather than automatic actions.
Start optimization
Methodology

How data moves from the exchange to the recommendation

The process is broken down into clear steps so that the user understands where each number on the panel comes from.

01

Data collection

The platform connects to connected exchange accounts and collects transaction, price and volume data.

02

Normalization

The data is converted into a uniform format so that the indicators of different exchanges are mutually comparable.

03

Analysis of the model

Predictive models look for patterns and estimate the level of risk for each position.

04

Insight delivery

The results are reflected in the dashboard as understandable recommendations and warnings, rather than raw data.

i
Data integrity. Each data source is logged and compared to the previous record to spot outliers or missing data before they affect the analysis.
Frequently asked questions

Answers to practical questions

Collected questions that most often arise for users who are starting to manage multiple exchanges and want to understand how the platform works on a daily basis.

Can Fungizol connect to multiple exchanges at the same time?

Yes, this is the basic task of the platform. The data of each connected account is combined in one panel, keeping the possibility to see a detailed view of individual exchanges as well.

How much time should be devoted to panel review on a daily basis?

The platform is designed so that a short daily overview – usually a few minutes – is sufficient, as the most significant changes and risk alerts are highlighted at the beginning.

Do forecasts guarantee profits?

No. Models estimate statistical reliability and risk based on historical and current data, but the market outcome always remains uncertain. The decision is made by the user.

Is the platform understandable if I have no financial analytics experience?

Yes. The technical indicators in the panel are supplemented with a simple explanation so that the user understands what the indicator means in practical terms.

How are connected accounts secured?

Connections to exchanges are made using only the necessary access rights, and data is processed in an encrypted environment. More detailed information can be found in the support section.

Get started with a unified view of your exchange accounts

Connect your existing accounts and see a unified dashboard of risk and insights the first time you log in.

Data is transmitted over an encrypted connection, and access rights for each exchange connection are limited to the minimum necessary.

Start optimization